Products

We develop shared solutions

Developing full-fledged software can be expensive and it is usually beyond what the non-profit sector actually needs: tools that work reliably and that solve enough of a problem that they save time and produce better quality data. We would describe our products as "stable prototypes".

When we get requests that tackle data problems that are common to other non-profits, we look for opportunities to generalize the solutions so that they can be adapted for other organizations. Re-using components of past work allows us to offer products at a substantial discount relative to the initial development cost. Our latest products are summarized here:


Starter Dashboard

Starter Dashboard   TRY ME

What It Does:
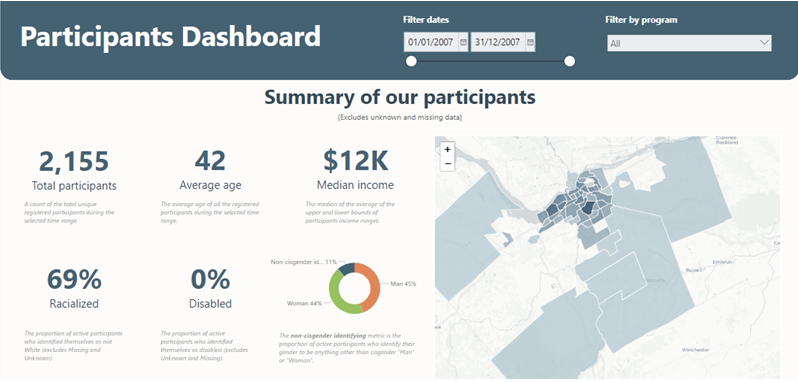
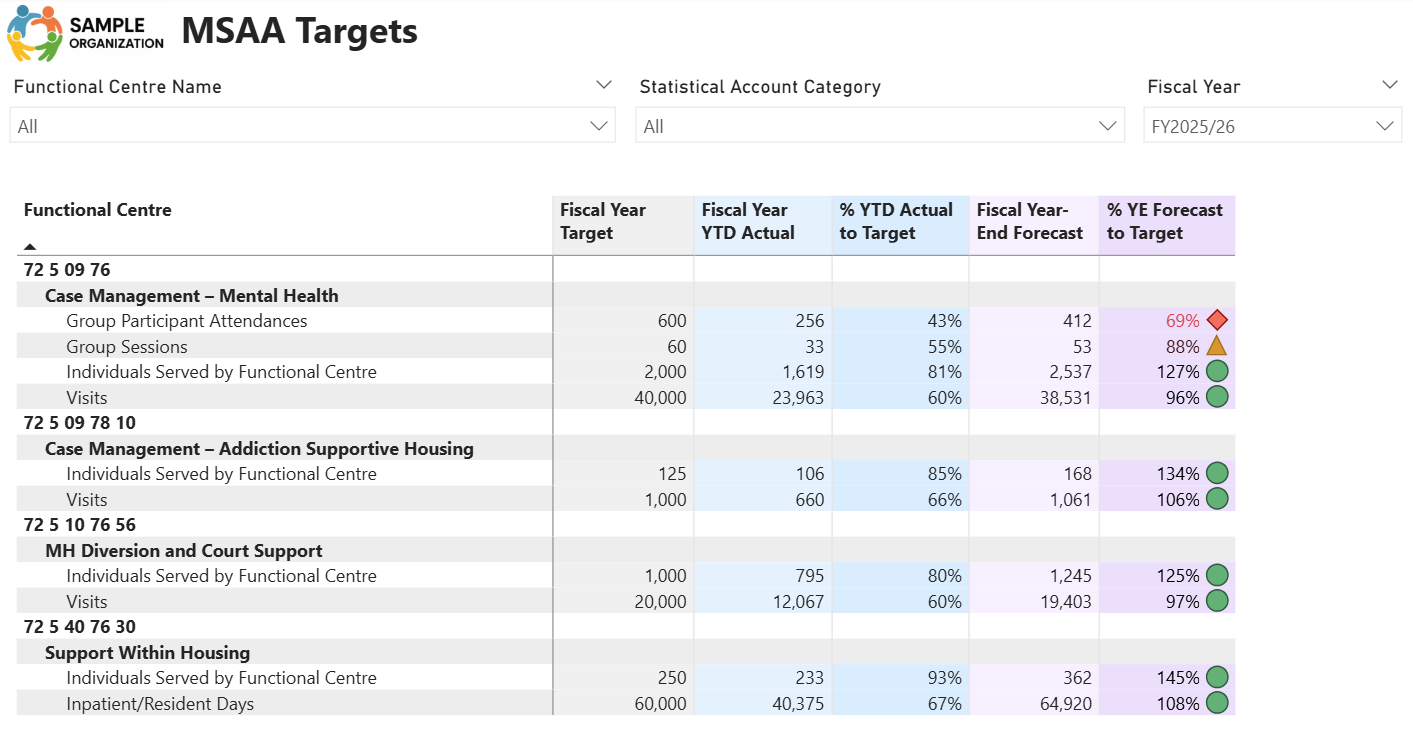
The Starter Dashboard offers community services organizations a quick way to get up and running with their first dashboard.
Context:
Dashboards provide organizations with a headline view of the data that they are collecting. For managers, this information can inform performance management and process improvement initiatives. For front-line workers, the data closes a feedback loop by showcasing the impact of their work and highlighting data quality issues.
The Problem:
Most client management systems or CRMs include some kind of self-service business intelligence solution, but building dashboards from scratch can be a time consuming and costly process. Furthermore, many community services organizations want to know similar things: who is using their services? how are the services being used? and what are the activities and interactions with participants?
How It Works:
The Starter Dashboard reads data extracted from your client management system or CRM on a nightly basis and provides a snapshot of your organization at a glance and at your fingertips in an interactive and easy-to-read format. It has also been designed with customization in mind and it can be extended to incorporate all of your important data points.
Tech Specs:
Built in Power BI, the Starter Dashboard runs in the Microsoft 365 cloud environment and can be accessed by users with Power BI Pro licences (available with Microsoft discounted nonprofit pricing).

Grant Spending Optimizer

Grant Spending Optimizer   TRY ME

What It Does:
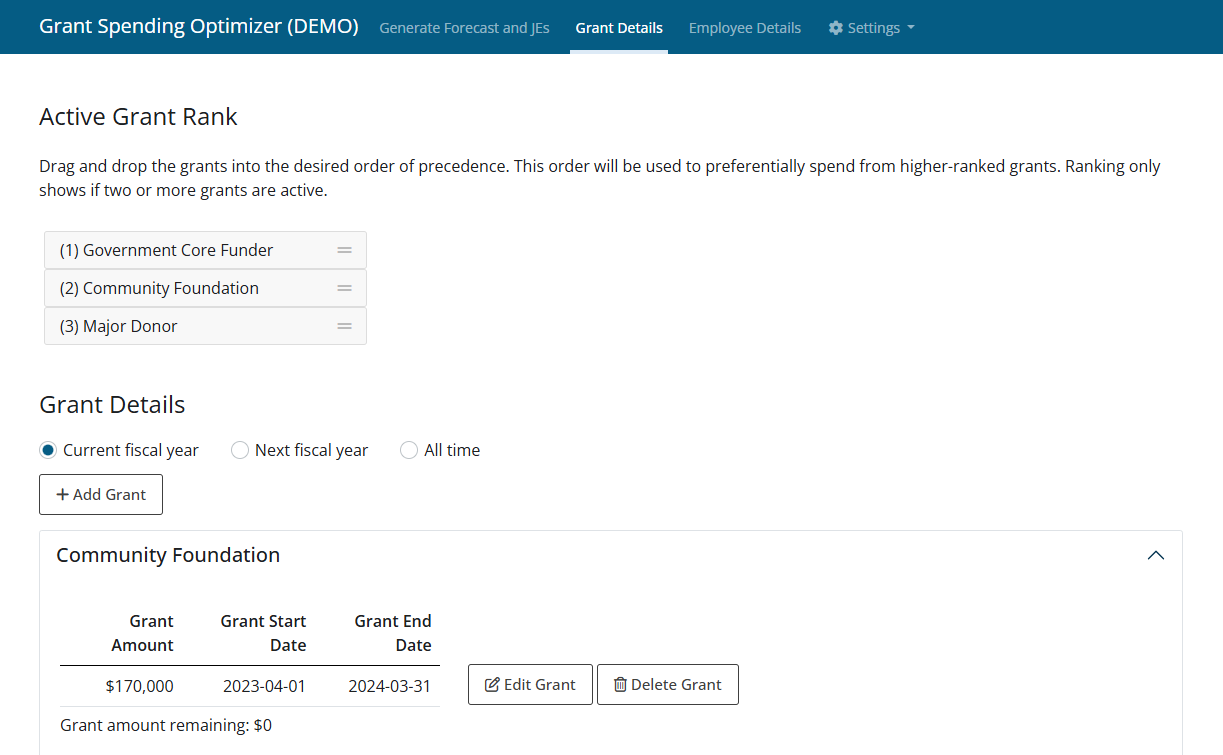
The Grant Spending Optimizer helps organizations to optimize their grant spending on payroll across multiple funding sources.
Context:
Organizations without a core funder often rely on multiple funding sources to pay their staff. The funding sources may start and end at different times so that one funding source that is needed to cover 20% of a full-time equivalent at the beginning of the year may be needed to cover 60% of that same full-time equivalent at the end of the year. If spending isn't optimized, organizations may be required to return money to the funder or dip into their reserves.
The Problem:
Budgeting grant dollars across multiple funding sources and multiple staff by hand is not a trivial task. It can take many hours of trial and error and it is highly susceptible to mistakes. Furthermore, the budget goes out of date whenever new funding comes in, requiring the process to start over again.
How It Works:
The Grant Spending Optimizer stores information about your staff, your grants, and the funding allocated to each position. It then performs a linear optimization calculating the optimal allocation of grant dollars to staff salaries for each pay period. The Grant Spending Optimizer can be run before your fiscal year starts to help with annual budgeting. Once the fiscal year in underway, it can read your fiscal year actuals so that the remaining pay periods can be re-calculated to reflect operating changes as the year unfolds. The Grant Spending Optimizer also generates journal entries for your bookkeeping software so that you can recognize grant spending in each pay period.
Tech Specs:
Built in R Shiny, the Grant Spending Optimizer can be installed in a secure and private hosting service such as Microsoft Azure.

Matchmaker

Matchmaker

What It Does:
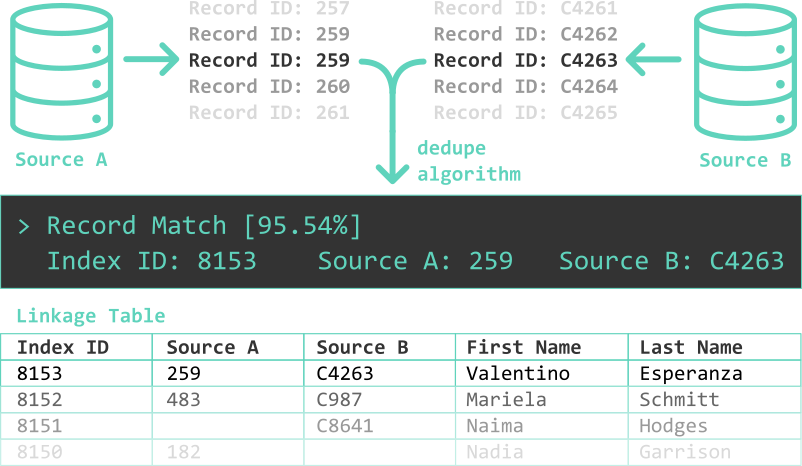
Matchmaker produces a master index and linkage table to connect records between databases.
Context:
Multi-service organizations often rely on several software systems and databases to deliver their work. This is because one tool usually can't do it all. For example, a system designed for scheduling meals on wheels may not be optimized to support another specialized service like employment counselling. In other cases, a funder may require that specific services use a central database.
The Problem:
In these settings, a participant that uses more than one service may wind up in multiple databases. As a result, it is difficult to count how many unique individuals are being served by the organization. And because participants are not usually tracked across systems with a common identifier, it is impossible to understand the pathways with which they are moving through an organization.
How It Works:
Matchmaker is built using DataMade's excellent dedupe Python package which employs fuzzy-matching techniques and cleverly leverages machine learning to cluster and weight matching criteria. The end result is a table with a single unique ID for each individual and a list of IDs for the corresponding source databases. If desired, this table can be used to create a deduplicated, consolidated database of unique individuals served by the organization.
Tech Specs:
Built in Python and compiled with a user interface for Windows, this program runs locally so that sensitive data never leaves your secure environment. It can also be adapted for other operating systems or automation on a server.

Retriever

Retriever

What It Does:
Retriever is an automated tool that fetches reports from web-based client management systems.
Context:
Client management systems excel at helping organizations to record and track information about service users. They typically come with a limited set of "canned" reports, but when these reports don't cover all your needs, the next best option is to export the data and build your reports in another tool.
The Problem:
Some client management systems can be greedy: they readily consume your information, but make it difficult to get it out. For example, exporting data can be a manual process that requires users to select a report from a list, set date ranges and other filters, and select a download format and destination. It's not a lot of clicks, but it adds up if you want to update your data daily or if you need to export multiple reports at a time.
How It Works:
Retriever mimics your mouse and keystroke interactions to automatically complete the steps required to export data from your web-based client management system. It can be set up to run on-demand or run on a scheduled basis (e.g. nightly) on a server. Choose as many reports as you like and define the date ranges and filters to configure for each export. The end result is a folder of reports saved in an Excel-friendly format that can be downloaded with a single click of a button.
Tech Specs:
Built in R Shiny with Selenium Server, Retriever has been programmed for use with VitalHub's Pirouette, but can be adapted for other web-based client management systems. It provides a simple user interface that can be triggered manually or set to run automatically on a server.

Questions?

Contact us to chat about adapting one of our existing products to your needs or to share a new product idea.

Get In Touch